Manage data sources and columns in a dataset (Step 3)
When creating or editing a dataset on the Step 3 – Join and preview page, you can manage the data sources and their columns as needed.
Manage data sources
Click Add source and follow the required steps for adding a new data source or a new connection. See also the following topics:
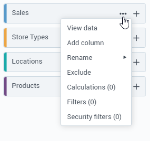
Next to a data source name, point to  More options, and then click Exclude.
Point to a data source name to view its details:
- (Files) The name of the original data file.
- (Server connections) The name of the data source and the original table name.
Next to a data source name, click  More options > View data. In the View data dialog, preview the data source columns in a tabular view. The number of rows for preview depends on the configuration setting.
Next to a data source name, click  More options > Rename > Data source, and specify a new name for the data source. The data sources (tables) names within a dataset must be unique.
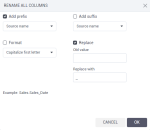
Next to a data source name, click  More options > Rename > All columns, and specify how to rename the columns:
- Add prefix – Add a data source name or a custom string in front of the column name.
- Add suffix – Add a data source name or a custom string after the column name.
- Format – Capitalize the column names: only first letter, all uppercase, or all lowercase.
-
Replace – Enter the text that you want to replace and specify a new text. For example, you can replace the underscore with the space character.
This menu item appears only if at least one column in this data source was previously renamed.
Next to a data source name, click  More options > Rename > Columns to original. All the renamed columns are reset to their original names.
Next to a data source name, click  More options > Calculations. The number in parentheses indicates the number of calculations in the data source.
You have several options for adding a calculation to a dataset. For details, see Add calculations.
Next to a data source name, click  More options > Filters. The number in parentheses indicates the number of filters applied to the data source.
Adding a filter reduces the amount of data available for analysis in a dataset. The resulting dataset and all the visualizations based on it will contain only data that are already filtered. In addition, visualizations will run faster. For details, see Add filters.
Next to a data source name, click  More options > Security filters. The number in parentheses indicates the number of security filters applied to the data source.
If no security filters are added, it means that all the data in a shared dataset is visible to all its recipients. With a security filter, some recipients have access only to a subset of data that is relevant to them. For example, each department can see the data related to the respective department and not the whole dataset.
For details, see Row-level security filters.
(Server data sources only) Next to the data source name, click  More options > Add column. Then, select the columns in the Add column dialog.
Manage columns
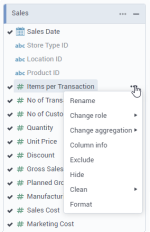
You can manage individual columns.
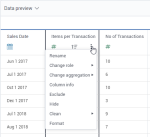
You can also manage columns from the dataset preview table.
Manage the columns as follows:
-
Hide – Click the column to hide it in the dataset. Alternatively, next to the column name, go to
 More options > Hide.
You can create calculations and filters based on the hidden columns. To preview the data in the hidden columns, in the Data preview section, click the Show hidden columns check box. Hidden columns are not available in visualizations.
To unhide, click the hidden column again. Alternatively, next to the column name, go to
 More options > Unhide.
 -
Exclude – Next to the column name, click
 More options > Exclude. The column is removed from this dataset. You can readd it any time later.
You cannot exclude the columns used in filters and calculations, but you can hide them for the dataset consumers.
-
Readd – To readd the excluded column, next to the data source name, click Add column, and select the column.
Manage the columns as follows:
-
Rename – Next to the column name, go to
 More options > Rename, and specify a new name for the column.
 -
Reset name – Next to the column name, go to
 More options > Reset name. This option appears only if the column was previously renamed.
You can apply the following cleaning and transformation actions to a column:
-
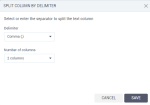
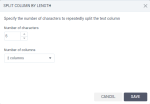
Split – Point to the column, click
 column options, and then click one of the following options:
 -
Clean – Point to the column, click
 column options, and then click one of the following options:
-
Format
- Make uppercase – Make all characters uppercase.
- Make lowercase – Make all characters lowercase.
- Capitalize first letter – Make the first letter uppercase and turn the rest to lowercase.
-
Remove
-
Punctuation – Remove selected types of punctuation in a string column.
-
NULLs – Add a filter to remove all rows with the NULL value in a column.
-
Blanks – Add a filter to remove all blank rows in a string column.
-
Zero values – Add a filter to remove all rows with zero value in a numeric column.
-
Negative values – Add a filter to remove all rows with a negative value in a numeric column.
-
-
Replace
-
Trim
-
Leading & Trailing spaces – Remove spaces at the beginning and at the end of the string in a column.
-
Leading spaces – Remove spaces at the beginning of the string in a column.
-
Trailing spaces – Remove spaces at the end of the string in a column.
-
All spaces – Remove all spaces in a column.
-
Leading character – Remove the specified character at the beginning of the string, in a column.
-
Trailing character – Remove the specified character at the end of the string, in a column.
-
-
Concatenate – Join two strings into one, with or without a separator in between.
-
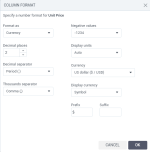
You can select a specific format for a numeric column. Point to a column, click  column options, and then click Format.
In the Column format dialog, select the format type to apply, customize its options, and click OK.
You can customize the following format options:
-
Decimal places
- Select the number of decimal places to display in the number. For example, depending on the decimal places, a number may look like 3.14 or 3.14159.
-
Decimal separator
- Select the separator to show for decimals: Comma (,), Period (.), Space (), or Custom to provide another separator symbol.
-
Thousands separator
- Select which separator to show every thousand, for example, 10,000 or 10.000.
- You can select Comma (,), Period (.), Space (), or Custom to provide another separator symbol. To show the number without any separator, select Custom and leave the field empty.
-
Negative values
- Select how to display negative values: -1234, (1234), or 1234-.
-
Display units
- Select a specific unit to abbreviate the numbers: None, Auto, Thousands (K), Millions (M), Billions (B), Billions (G), and Trillions (T).
- For example, if the number is 47,000 and the display units are Thousands (K), the number is shown as 47K.
-
Prefix
- Specify characters that precede each displayed number.
-
Suffix
- Specify characters that follow each displayed number.
You can customize the following format options:
-
Decimal places
- Select the number of decimal places to display in the number. For example, depending on the decimal places, a number may look like 3.14 or 3.14159.
-
Decimal separator
- Select the separator to show for decimals: Comma (,), Period (.), Space (), or Custom to provide another separator symbol.
-
Thousands separator
- Select which separator to show every thousand, for example, 10,000 or 10.000.
- You can select Comma (,), Period (.), Space (), or Custom to provide another separator symbol. To show the number without any separator, select Custom and leave the field empty.
-
Negative values
- Select how to display negative values: -1234, (1234), or 1234-.
-
Display units
- Select a specific unit to abbreviate the numbers: None, Auto, Thousands (K), Millions (M), Billions (B), Billions (G), and Trillions (T).
- For example, if the number is 47,000 and the display units are Thousands (K), the number is shown as 47K.
-
Currency
- Select a currency from the list or specify the custom currency.
-
Display currency
-
Select how to display currency: as a symbol ($) or as an international symbol (USD).
-
Prefix
- Specify characters that precede each displayed number.
-
Suffix
- Specify characters that follow each displayed number.
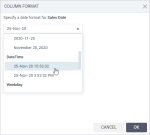
You can customize the following format options:
-
Decimal places
- Select the number of decimal places to display in the number. For example, depending on the decimal places, a number may look like 3.14 or 3.14159.
-
Multiply by 100
- Select whether to multiply the number representing a percentage. For example, the value of 0.05 will be formatted as 5%.
For each column, check if a data role is profiled correctly and change it if necessary.
Next to a column name, go to  More options > Change role, and select another data role. For details, see Change the data role.
Check the aggregation type for each column, and adjust it if needed. The aggregation type that is defined at the time of a dataset creation is a default type for that measure in a visualization.
Next to a column name, go to  More options > Change aggregation, and select another aggregation type.
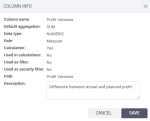
To check the column details, next to a column name, go to  More options > Column info.
In the Column info dialog, review the following details:
- Column name – The name of the column in this dataset.
- Default aggregation – The aggregation to be used by default in visualizations.
- Data type – INT, NUMERIC, DATE, or STRING.
- Role – Measure, dimension, geo dimension, and date.
- Calculation – Indicates if this column is a calculation.
- Used in calculations – Indicates if this column is used in a calculation.
- Used as filter – Indicates if this column is used to filter the dataset.
- Used as security filter – Indicates if this column is used to secure data in the dataset per users or groups.
- Path – (Server data sources only) Shows the path to the column.
- Description – Specify the description of the column. This description appears in a tooltip when you point to the column in this step of the dataset preparation. .
