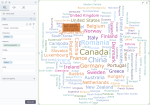
Word cloud
|
|
|---|
|
Word cloud |
Word cloud allows you to visualize a list of words, where the size of each word represents a measure assigned to it. For example, the city’s names can be visualized based on gross sales associated with them: the bigger the name, the more profitable is the city. You can color the words by another dimension.
When to use
Word cloud is useful to quickly highlight the most prominent terms. It is aesthetic and works well to reveal the essentials. However, a word cloud can be misleading because long words seem to be more prominent among bigger but shorter words.
Data requirements
To build this chart, define the required and optional data fields as follows:
- Dimension – One dimension
- Measure – One measure
- Tooltip – (Optional) One or more measures
- Color – (Optional) One dimension
Use case
The following word cloud shows the list of countries, where the word size represents the respective average unit price per country. The countries are colored according to the geographic regions.
References
For details on how to customize your visualization, see Visualization settings.
For a whole list of visualizations, see the following topics:
- Visualizations by function (find a visualization to suit your business case)
- Visualizations by type (find a visualization based on how it is organized on the interface)

