MLLIB.SPEARMANCOR(columns)
Calculates the Spearman correlation coefficient between selected columns to assess the monotonic relationship between two continuous or ordinal variables. A monotonic relationship is the type of a relationship when the value of one variable increases, and so does the value of the other variable or when the value of one variable increases and the other variable value decreases.
Spearman’s rank correlation coefficient is a measure of rank correlation. In other words, it is based on the ranked values for each variable rather than the actual data values, and thus, it is not sensitive to outliers. Spearman correlation is best for measurements taken from ordinal scales like rank orders or spectrum of values (agree, neutral, disagree).
Input data
- Two numeric variables
- Size of input data is not limited
- Without missing values
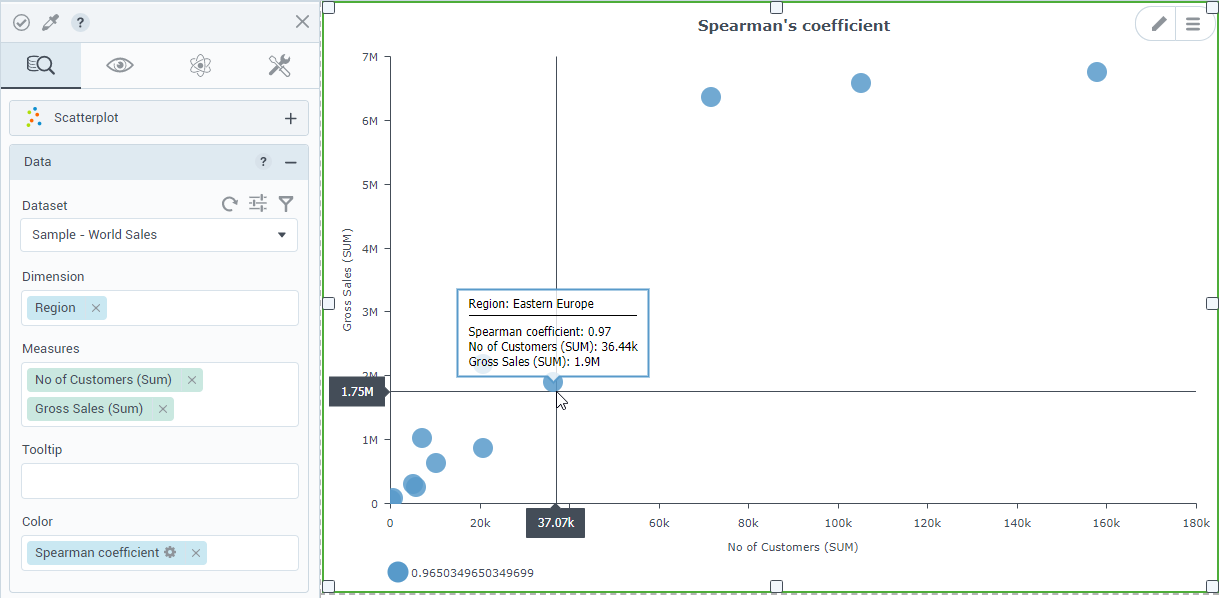
Example: MLLIB.SPEARMANCOR(sum([Gross Sales]), sum([No of Customers]).
Result
The correlation coefficient measures the strength of the relationship between two variables (from -1 to 1). For example, the value of -1 shows a perfect negative correlation, the value of 1 indicates a perfect positive correlation, and the value of 0 — no linear relationship between the two variables.
Example
Using the Scatterplot widget, add a calculation with the MLLIB.SPEARMANCOR(sum([Gross Sales]), sum([No of Customers])), but set to dimension. Using the dataset manager, drag it into the Color field. The function returns a single value, so only one color is used. The coefficient value is shown in the legend and the tooltip for each pint of the visualization. The coefficient of 0.97 indicates a strong positive correlation.
For the whole list of algorithms, see Data science built-in algorithms.